
While the National Association of Independent Schools reports the median inflation-adjusted private K-12 tuition has decreased nearly two percent since 2019, many families will find the most recent year’s figure of $33,885 to be out of reach.
To cover tuition costs and expenses, 45 percent of private school households make withdrawals from personal savings, 58 percent reduced retirement contributions, 33 percent got an additional job, and eight percent downsized their homes.
Financial aid plays a major role for these families like these on the fence, as even relatively small awards can be the difference between enrollment and searching for a more affordable school.
To provide a more complete picture, we took anonymized data from users of Ravenna Financial Aid® (you may also know it as SSS), including a vast scope of applicants, tax data, and financial aid distributions. The data covers financial aid applicant journeys across the 2024-25 awarding cycle, representing a sample of over 16,000 students across the United States.
We’ll break down the major trends from the most recent financial aid cycle to give schools and families insight into who receives awards and distributions.
RELATED: Making Financial Aid a Recruitment Tool for K-12 Private Schools
Part 1: Family Demographics: Who Is Applying for Financial Aid?
Financial aid applicants come from a diverse range of backgrounds. With median age and incoming grades of 11 and seventh, respectively, families with students of all ages are applying, indicating schools aim to serve students across their community, rather than focusing on one grade or age group.
On a similar note, 63 percent of applications came from returning students, meaning just over one-third of financial aid hopefuls were students also applying for enrollment to a school. Data from Ravenna Admissions® suggests roughly 30 percent of students at a school are in their first year of enrollment, so despite the large difference in number, these figures suggest an equal rate of application among new and established students. Schools can look at ways to increase the amount available to established students as a means of strengthening retention efforts.
In terms of the families themselves, two-thirds represent the typical two-parent household, and overall, the average family size hits 3.96 people. This is correlated to why roughly half (48 percent) of applying households were paying for multiple tuitions.
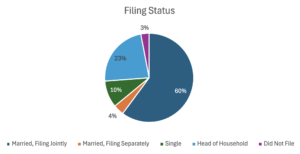
The filing status paints a similar, but more nuanced, look at the average private school family. While 60 percent were the typical “Married, Filing Jointly,” 23 percent filed as the much more ambiguous “Head of Household,” and ten percent filed as “Single.” Schools need to ensure their financial aid awarding processes don’t hold biases toward traditional household types, while nontraditional families don’t need to shy away from applying.
The U.S. average household applying for financial aid owns a home (63 percent), bought for $735,069 in 2017. Now established homeowners nearly a decade later, this average family provides ample opportunity to grow school revenue and community for many years.
Tuition may, however, cause some financial strain on the average family budget. The Huffington Post finds the average family spends $3,600 for a single vacation, while families from this data set average $1,700 per year. Debt, too, is an issue, at an average of $28,372 per household.
Also of note: the gender split was 51 percent female : 49 percent male ratio, and two percent of applications were for the child of a faculty member.
Part 2: Expected Financial Contribution: What Factors Do Schools Consider?
Now that we see who applies for financial aid, it’s important to understand what schools examine when reviewing applicant folders. Not so surprisingly, given anxiety over how recent Supreme Court rulings on affirmative action may impact K-12 schools, only 11 percent of schools recorded applicant ethnicity. Whether this information was a factor beyond reporting remains unclear, so there’s little reason to suspect race and ethnicity currently play much of a role in financial aid distributions.
Typically, schools use an Expected Financial Contribution (EFC) in their calculations, a measure of a family’s ability to pay tuition based on factors like income, assets, and major expenses.
So, what exactly do schools use in an EFC? It differs from school to school, but almost all (94 percent) take home equity into account. On the other hand, only five percent look at dividend and interest accumulation.
Forty-three percent examine monthly income and expenses from the past 12 months, 11 percent (likely in large cities) include a cost-of-living adjustment, and ten percent evaluate assets across multiple years in their calculations.
While the more than 1,200 schools observed in this sample were all Ravenna Financial Aid users, it’s surprising how 100 percent took advantage of its direct integration with the IRS to verify family tax information. It’s easy to see why, with a trove of 50+ reports available detailing each family’s full financial picture — and it only takes parents 60 seconds to authorize.
Part 3: IRS Data: How Does Ravenna Financial Aid Give Schools the Full Picture?
Now, let’s get into the data behind each EFC calculation. Through a mix of IRS and self-reported data, schools using Ravenna Financial Aid had access to the following insights for each family.
Starting with yearly finances, the average family had $129,832 in adjusted income across the household. However, only five percent of these households had dual income from two parents, and 24 percent took itemized deductions. While the average federal income tax on these applicants came in at $45,936, the median was much lower at $11,268. Likely, this indicates a small number of major earners greatly inflating the average.
Speaking of top earners, Ravenna Financial Aid also gathers information on household business assets and expenses. Business and farm owners account for 11 percent of applicants, having an average equity of $108,246. Nearly half (five percent) own multiple businesses.
Thirteen percent of households have income from a self-employed role. It’s hard to tell the difference here between true small business owners and middle-class contractors, but schools should be aware self-employment continues to grow as an option for many families, which sometimes translates to unstable income.
In terms of major assets, the average home was purchased at $735,069 ($1,010,763 when adjusted for inflation) and now has a value of $1,423,638.
When it comes to miscellaneous income, those who claimed investment gains or losses netted an average of $16,993. In addition, seven percent of households received child support, three percent took at least one distribution from a retirement account, and four percent took unemployment payments in the year prior.
In all, the average household bank accounts were valued at $22,724, and the median net worth was $240,066.
Part 4: Financial Aid Distributions: Who Got an Award?
Given the breadth of tax information available, schools were able to make truly fair, mission-aligned awards.
The average household’s EFC came out to $17,769, so it’s no surprise 32 percent of households had an EFC of less than $0, which typically calls for financial aid to cover the full cost of a family’s tuition. Similarly, 33 percent of households were determined to have zero discretionary income, which contributes to the same conclusion.
Arriving at the important numbers, 36 percent of applicants received financial aid, including students who received partial aid coverage, with an average award of $17,527. It’s important to note this number doesn’t cover separate tuition discounts or track awardees who opted to enroll at another school.
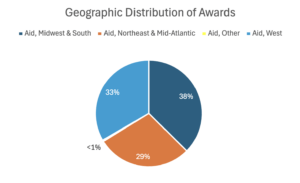
Here’s a breakdown of financial aid distributions by U.S. region. The Midwest and South combined for 38 percent, the Northeast and Mid-Atlantic for 29 percent, the West for 33 percent, and other geographies (i.e., territories) with the remainder, less than one percent.
In total, private schools awarded $100,375,909 to K-12 students across the country. There is plenty of money available to families looking to apply. But when breaking down who received aid, major differences arise when comparing grade level and student status.
Pre-kindergarten applicants (also: nursery, junior kindergarten, preschool) made up 4.90 percent of awardees, and that number stays within a percentage point throughout kindergarten and elementary school. When students cross into middle school, their share of awards climbs to 8.09, 7.82, and 8.76 percent for sixth, seventh, and eighth grades, respectively.
At the high school level, however, more students tend to receive financial aid, with rates ranging from 9.16 percent (twelfth grade) to 10.50 percent in ninth grade. The full data reads as follows:
| Grade Level | Percent of Awardees |
|---|---|
| Pre-K | 4.90 |
| Kindergarten | 4.97 |
| First Grade | 5.16 |
| Second Grade | 4.81 |
| Third Grade | 5.04 |
| Fourth Grade | 5.66 |
| Fifth Grade | 5.25 |
| Sixth Grade | 8.09 |
| Seventh Grade | 7.82 |
| Eighth Grade | 8.76 |
| Ninth Grade | 10.50 |
| Tenth Grade | 10.33 |
| Eleventh Grade | 10.33 |
| Twelfth Grade | 9.16 |
| Other | 0.14 |
One reason for this trend may come from the way families naturally think of private schooling. In formative, younger years, there is a higher demand for the best education possible, and that demand gradually decreases for a number of reasons. For families of older students who may not have as strong of a desire to continue, financial aid becomes a powerful tool to sway them toward re-enrollment.
That reasoning explains much about our final trend. When comparing the rates of returning students receiving awards to new students, the ratio stands at an astounding 79 percent : 21 percent rate. Returning students are four times as likely to receive a financial aid distribution as their newer peers.
Part 5: Takeaways: How Can Schools Improve Financial Aid Awarding?
Schools that act on these insights have the opportunity to strengthen enrollment, build trust with families, and make every aid dollar count. Here are three ways to turn this year’s trends into a smarter awarding strategy.
Spend “Recruiting Money” Wisely
Most schools never see this depth of financial detail about applicants. With verified IRS data and 50-plus reports at your fingertips, you can align awards with your mission with the full picture for each family. Put that advantage to work.
The grade-level and returning-student trends offer an easy starting point. Returning students are four times as likely to receive an award as new students, and older students receive aid at higher rates than younger ones. If retention drives your budget, that pattern may already reflect your strategy. If growth is the goal, consider directing more aid toward new applicants and younger grades to fill your pipeline early. Either way, let the numbers guide your budget rather than habit.
Give Families the Transparency They Want
Families make real sacrifices to afford tuition. Nearly half draw from personal savings, and many reduce retirement contributions or take on extra work. When they apply for aid, they want confidence that the process is fair.
You can offer that confidence with a clear methodology. Explain what factors shape an award, from home equity to monthly income and expenses, and share how your school approaches need. This is also a good moment to review your assumptions for hidden bias. Household types vary widely: 23 percent of applicants filed as head of household, and ten percent filed as single. Make sure your awarding process treats nontraditional families as fairly as two-parent households. A transparent, consistent method backed by verified data reassures families that everyone gets an honest review.
Ravenna Financial Aid features the only NAIS-backed evaluation methodology for exactly this reason. Parents deserve a fair, equitable process backed by the industry standard.
Promote an Easier Process
An easy application invites more submissions, and more submissions mean a wider, more diverse pool to draw from. Friction does the opposite. Every extra document or confusing step can discourage a family from applying to your school.
Reducing friction is one of the simplest wins available. With Ravenna’s direct IRS integration, families authorize their financial data in about 60 seconds and complete one guided application for multiple schools in under nine minutes, eliminating the need for any document uploads.
That speed is worth promoting. Highlight it in your admissions materials, open house talks, and outreach to returning families. When applying feels simple, more families follow through, giving your team greater control of allocation.
Turning Insight Into Action
This year’s data confirms there is real money available and real opportunity in how you distribute it. Financial aid can be a real strength to your school, so look for ways to make the application process more thorough and inviting.
The right strategy, plus the right solution, combine to get mission-aligned students in your classrooms year after year.
Frequently Asked Questions
Has private K-12 tuition gotten more expensive in recent years?
Surprisingly, private K-12 tuition has decreased nearly two percent since 2019 when adjusted for inflation, according to the National Association of Independent Schools (NAIS).
Who receives the most financial aid distributions?
Two trends, supported by data from Ravenna Financial Aid, show where private K-12 schools strategically distribute financial aid money. First, financial aid is distributed at a larger percentage to students as they get older, with more high schoolers receiving awards than middle schoolers or those in early education. Second, schools hand out awards to four times as many returning students as new applicants, often as a way to encourage families to re-enroll year after year.
How is household income related to private school affordability?
Data from Ravenna Financial Aid users found the average family applying for aid had $129,832.13 in combined household income. The average household bank accounts were valued at $22,723.66, and the median net worth was $240,065.88. Assumptions that either only rich families can afford private education, or that only lower-income families receive aid, aren’t backed by data.